Overview
Wazuh is the SIEM I run in production — not just administered, but engineered. A SIEM is a pipeline, not a single product: agents collect, the manager decodes and correlates, the indexer stores, the dashboard is where humans hunt, and alert routing is where detection becomes action. The stage most teams under-invest in is the last one — an alert nobody sees doesn't exist.
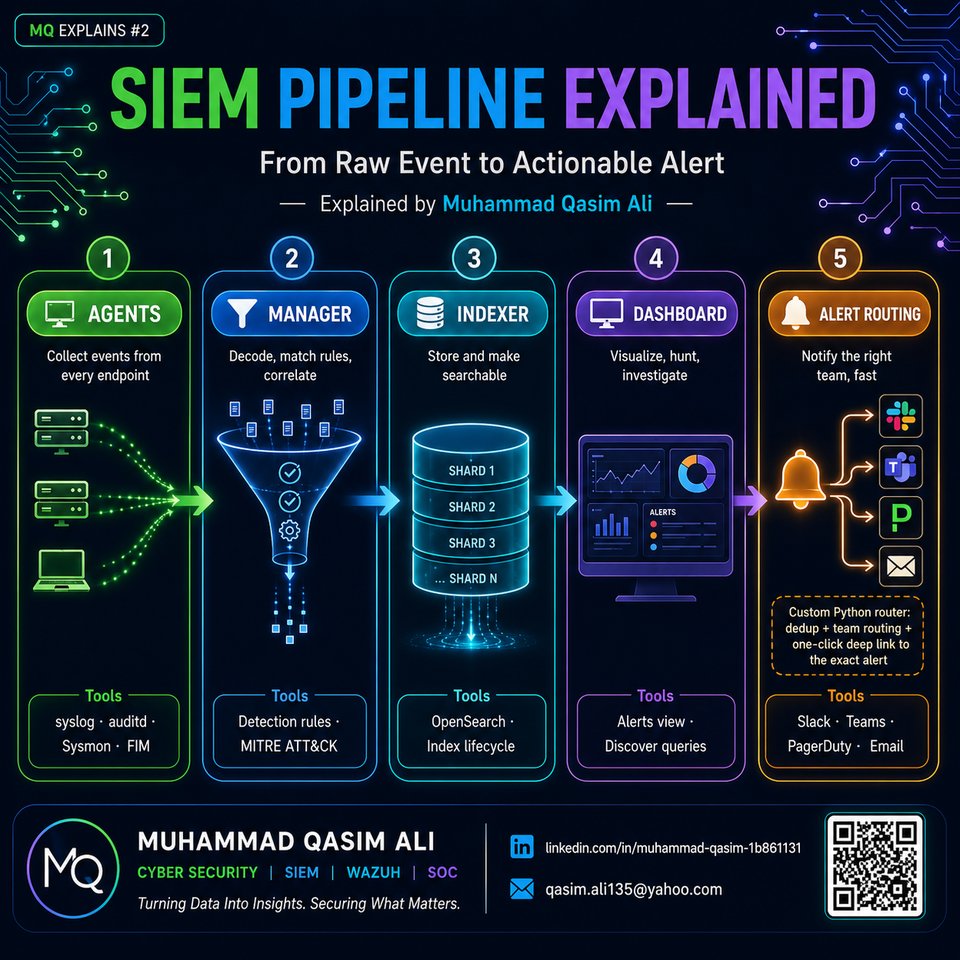
Architecture
| Component | Role | What I tune |
|---|---|---|
| Agents | Collect events from every endpoint | Agent grouping, policy management, FIM scope |
| Manager | Decode, match rules, correlate | Custom local rules, MITRE ATT&CK mapping, false-positive suppression |
| Indexer | Store and make searchable (OpenSearch) | Shard allocation, index templates, lifecycle policies |
| Dashboard | Visualize, hunt, investigate | Saved searches, alert views |
| Alert routing | Notify the right team, fast | Custom Python framework — dedup, team routing, deep links |
Configuration Reference
Manager health & diagnostics — first commands in any incident
sudo systemctl status wazuh-manager
sudo tail -f /var/ossec/logs/ossec.log
sudo /var/ossec/bin/agent_control -l          # list agents and connection state
Test a detection rule without waiting for a real event
sudo /var/ossec/bin/wazuh-logtest
# paste a sample log line, e.g.:
#   Failed password for root from 203.0.113.50 port 22 ssh2
# output shows: which decoder parsed it, which rule fired, and the alert level
OpenSearch cluster — the layer underneath the SIEM
# cluster health at a glance
curl -sk -u admin:PASS https://localhost:9200/_cluster/health?pretty

# per-index size and doc counts
curl -sk -u admin:PASS https://localhost:9200/_cat/indices/wazuh-alerts-*?v

# shard distribution — the exact thing that broke and taught me this
curl -sk -u admin:PASS https://localhost:9200/_cat/shards?v | headcluster.max_shards_per_node ceiling, from months of daily indices each carrying more primary shards than the workload needed. Immediate fix raised the limit to restore visibility; the permanent fix reduced primary shards per index and added lifecycle-based deletion of old indices so it can't happen again.
curl -sk -u admin:PASS -X PUT https://localhost:9200/_cluster/settings \
  -H 'Content-Type: application/json' \
  -d '{"persistent":{"cluster.max_shards_per_node":1500}}'
The alert-routing layer (custom Python framework)
Wazuh's built-in integrations are a starting point; production needs more: team-based routing by agent group, deduplication so one noisy rule doesn't page fifty times, severity-gated escalation to PagerDuty, and HTML email notifications that deep-link straight to the exact alert in the dashboard. Core shape of the router:
# simplified shape of the routing logic
def route_alert(alert):
    if is_duplicate(alert, window_minutes=15):
        return  # suppressed — already notified for this root cause

    team = TEAM_MAP.get(alert["agent"]["group"], "default")
    severity = alert["rule"]["level"]

    if severity >= 12:
        pagerduty.trigger(alert, team=team)
    email.send(
        to=TEAM_EMAILS[team],
        subject=f"[{severity}] {alert['rule']['description']}",
        body=render_html_template(alert, dashboard_deeplink(alert["id"]))
    )
Real Project: SIEM Engineering at Constellation
Beyond keeping the SIEM online, the meaningful work was making it usable: custom detection rules tuned against false positives, File Integrity Monitoring, vulnerability detection and Security Configuration Assessment, MITRE ATT&CK-aligned reporting — and the Python alert framework above, which turned "go look through a dashboard" into "click the link in the email and land on the exact alert." Investigation time dropped accordingly.